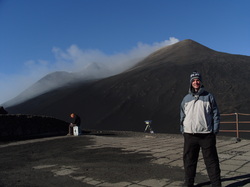
 Me at the North-East Crater of Mt. Etna Me at the North-East Crater of Mt. Etna Its certainly a great feeling to get that first publication (with colleagues of course!) under my belt on the creation of a technique for capturing high time resolution fluctuations in CO2 at a 1 s interval, published in the Journal of Volcanology and Geothermal Research. To the right is the location of the study, the NEC of Mt Etna, one of the more frequently used pictures on my blog! The picture is taken from the Pizzi Deneri Observatory. So, how did we produce the dataset, and why is it important? Firstly, the ability to directly measure CO2 with traditional remote sensing techniques is difficult, primarily because of the very high atmospheric background levels of the gas! We therefore combined the use of ultra-violet cameras (for more info see Mori and Burton, 2006) to measure SO2 and an instrument called a Multi-GAS analyser (for more info see Aiuppa et al. 2005) which has the ability to measure CO2/SO2 ratios. We can then combine the two sources of data to produce a CO2 flux series. 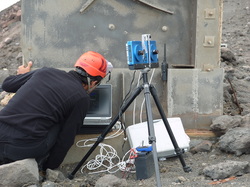 Using the UV camera at Stromboli. Using the UV camera at Stromboli. So, why is the ability to view CO2 at 1 Hz important? Simply put, CO2 exsolves from magmas at greater depths than the other common volatiles H2O and SO2. We can therefore get a better idea of any fresh injection of magma into storage systems if we have detailed records of CO2 emissions. Prior to this point (to my knowledge anyway!), it hasn't been possible to directly compare CO2 emissions at this high rate (of 1 Hz) with other volcanic information, such as seismic and infrasonic data. As a result we reveal interesting trends that may be shared between CO2, SO2 and seismicity. For more information see the paper! Below is the "AudioSlides" presentation created for the paper, which is great by the way, it has to be less than 5 minutes long and certainly condenses any paper into an easily digestible format, I would certainly encourage others to do something similar!  In a fantastic end to the first day of VMSG a "Rubbish Bin Volcano" was exploded, using liquid nitrogen similar to this previous example from the University of East Anglia. On the right I am ashamed to say is my poor poor attempt at painting the University of Sheffield name onto my duck. Needless to say, art, or hand-writing of any sort is not my strong point! Although I did manage to get some great glow-in-the-dark paint from Hobbycraft... Anyhow, below is the video of the volcano below, if you were there, you can relive the 'eruption', if you weren't here it is for the first time! It's certainly a great example and analogue for the rapid expansion of gas, ash (and ducks) at the beginning of an explosive eruption. You can also see the 'eruption' in thermal infrared here. The rest of the day was devoted to posters/talks on intra-plate volcanism and rifting, with tributes to the late Barry Dawson. A broad mixture of talks today on topics ranging from Kimberlites, Feripicrites and the fantastic carbonatite lavas of Oldoinyo Lengai. It was great to hear Mike Widdowson talk about the recent 2013 Nature Geoscience paper on the Shatsky Rise Oceanic Plateau and the discovery that the Tamu Massif could be the largest shield volcano on Earth. |
 Archives
July 2023
|
 RSS Feed