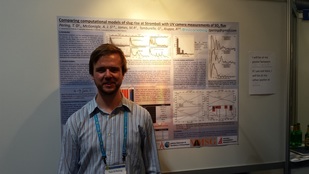
 Me with one of my posters (Photo kindly taken by John Browning) Me with one of my posters (Photo kindly taken by John Browning) Another year and anther EGU has come and gone in the wonderful city of Vienna. It was an early start on the Monday morning with two posters to present in the evening. Up they went and off I go to the rest of the days sessions, brimful with interesting insights based on remote sensing of volcanic gases from as far south as Erebus. On returning to my posters at 1 pm, I noticed that one of them had disappeared! Was this academic sabotage? Definitely not. Apparently the poster had probably fallen off the board (beware fabric posters!) and the cleaners "cleaned it away"...a look in the conference bins (with the help of the helpers) proved fruitless. Much kudos has to go to staff at the printer poster service and the helpdesk for swiftly printing another one in time for the evening poster session! Wednesday saw the finish of the Volcano Monitoring Using Instrument Networks session and a couple interesting presentations on the recent lava flow activity at Stromboli in the latter half of Summer 2014. On previous occasions, paroxysms at Stromboli have followed on from these lava flow events, however, on this occasion this was not the case - demonstrating the need to monitor these systems and detail and the variability and unpredictability of volcanic systems! Measurements of CO2 flux and gas ratios provided interesting insights into why a paroxysm may not have developed on this occasion (presentation given by Aiuppa). Before this Tamburello discussed the intriguing possibility of using changes active degassing (strombolian eruptions/puffing) to passive degassing ratios to investigate the state of the system at Stromboli. Wednesday also saw the start of a session dedicated to the recent Bardabunga and Holuhraun activity. This was a fascinating session, purely because much of the science was shiny new. A large portion of the presentations were dedicated to calculating gas emissions from the fissure activity at Holuhraun. These demonstrated that SO2 was injected at incredible rates of ~ 1000 to 4000 kg per second during the early stages of the eruption (in presentation given by Barsotti). When you consider that a quiescent Etna can release around 2 to 10 kg per second (the exact figures escape me) this is a huge difference and is a very important aspect in determining the style of observed activity. A BBC article on Bardarbunga was quickly written after the session and touches on the importance of these events to the UK. Time to do some sight-seeing. |
Archives
July 2023
|

 RSS Feed