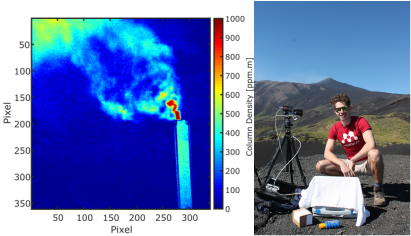
 Left - Example image of sulphur dioxide emissions from a power station. The image was created using two different wavelengths of UV light. Right - Tom Wilkes on the flanks of Mt Etna with the Raspberry Pi UV camera system. Left - Example image of sulphur dioxide emissions from a power station. The image was created using two different wavelengths of UV light. Right - Tom Wilkes on the flanks of Mt Etna with the Raspberry Pi UV camera system. Last week our article "Ultraviolet Imaging with Low Cost Smartphone Sensors: Development and Application of a Raspberry Pi-Based UV Camera" was published in the Journal Sensors. The article is fully open access so can be downloaded in full! This work is the result of a continuing collaboration between the Department of Geography and the Department of Electronic and Electrical Engineering at the University of Sheffield, with the majority of the leg work done by current PhD student Tom Wilkes (Geography). In my last blog post, I talked about ultraviolet (UV) cameras, how they work, the improvements on previous techniques, and why we need them. However, the majority of current UV cameras are quite expensive! For a completely functioning system the costs may range anywhere between £10k to £50k. In our latest paper we detail a new method which uses the low cost Raspberry Pi camera and the Raspberry Pi computer to significantly reduced the costs of a complete UV camera system to perhaps <£500. There are also several other benefits of using the Raspberry Pi based set-up, including: a reduction in power needs, a reduction in the weight, and the ease of finding necessary parts. The majority of digital cameras and sensors such as the Raspberry Pi camera, when they are used unaltered, are sensitive only to visible light. This makes sense, as most of the time we want to take pictures which resemble what we see with our eyes! However, by removing certain layers from the surface of the camera sensor we can significantly increase the sensitivity to UV light at the wavelengths needed to measure the absorption of UV light by sulphur dioxide for example (see Figure above and video below for example application at a power station). There are also several other UV imaging applications which could benefit. The development of this new method also necessitated the purchase of new lenses (to focus the UV light onto the sensor) and the design of a new lens holder which was 3D printed. For full details see the published paper. Being a part of the development of this new method from the outset has been fantastic fun, and it is always amazing when everything turns out better than expected! 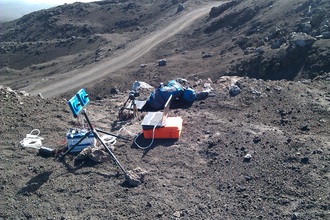 Ultraviolet cameras set up on the flanks of Mt. Etna. Ultraviolet cameras set up on the flanks of Mt. Etna. I have realised that I often talk about my work using UV (Ultraviolet) cameras on this blog but I have never properly explained how they work and why we specifically use them! So here I go. Monitoring volcanic gas release is one of the major things volcanologists can do to aid with eruption forecasting (see this recent post by James Hickey to understand why we call it forecasting). A number of techniques have therefore been developed and used to measure the release of volcanic gases from volcanoes. One of such techniques is the UV camera (Bluth et al. 2007; Mori and Burton, 2006), pictured on the right. These were developed to solve the time and spatial issues with previous techniques (e.g., DOAS and COSPEC). These previous techniques required building up a plume profile using a stepper motor to scan across a plume or traversing under it. Traversing could be conducted on foot, by moped, by car, or aircraft! The UV camera immediately solves this problem as it essentially works like a conventional camera by taking still images using the UV part of the electromagnetic spectrum, instead of visible light like your everyday camera. The UV camera and previous techniques all work on the principle of absorption of UV light by the volcanic gas sulphur dioxide (SO2). We specifically use SO2 due to the very low atmospheric background concentration of this gas. This makes it very easy to resolve the volcanic component. We can then, using two different cameras taking images at exactly the same time, compare two images (captured at the same time from each camera) where SO2 does and doesn't absorb (310 and 330 nm respectively). The graphic below illustrates the basic concept. 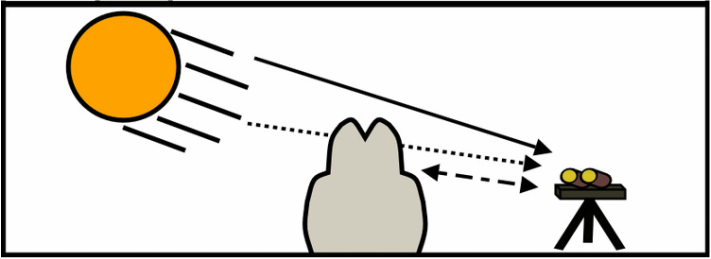 Graphic demonstrating the principle of ultraviolet spectroscopy. Incoming solar radiation (sunlight) is absorbed by sulphur dioxide within the volcanic plume. Light which isn't absorbed continues to the ultraviolet camera where the light intensity is recorded. 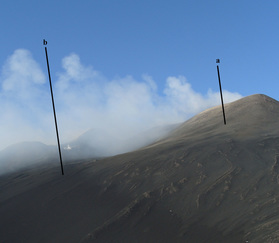 The plume from the NEC at Mt. Etna. Lines (a) and (b) indicate locations used to calculate plume transport speed. The plume from the NEC at Mt. Etna. Lines (a) and (b) indicate locations used to calculate plume transport speed. We can then use the Lambert-Beer law to combine the images captured at each wavelength to work out the strength of absorption in each pixel. At this stage the calculated value will preserve real fluctuations in concentration but we won't know exact SO2 values without calibration! There are two distinct ways of doing this. The first method is to image quartz gas cells, with known concentrations of SO2, with both cameras. We can then use the Lambert-Beer law again to combine the images at the separate wavelengths (310 and 330 nm - where SO2 does and doesn't absorb), which will create a series of new images with the absorption strength in each pixel - but this time we know exactly how much gas should be in front of the image - we can therefore use this to create what we call a calibration curve (or line) to map the values in the image of the volcanic plume to real SO2 concentrations. The second method is to combine the DOAS method (Differential Optical Absorption Spectroscopy) with the UV camera images. DOAS works in a different way, essentially measuring a single pixel in the plume, and it has the ability to determine actual SO2 concentration (based on the absorption structure of SO2 at different wavelengths). During acquisition the concentration of SO2 will change at the location the DOAS is pointing, again enabling us to calibrate our images through comparison of the absorption pixel values in the UV camera images for the same pixel with the known value. Both of these processes are illustrated in the photo slideshow below. We can then calculate the rate at which SO2 is released from a specific crater, vent or fumarole by multiplying the plume speed by the total concentration of SO2 contained along a single line (e.g., line [a] in the image above), what we call the integrated column amount. Plume speed can be determined in a couple ways, including: optical flow algorithms which map the movement of pixels from image to image (e.g., Peters et al. 2015) or by using a cross-correlation technique (e.g., McGonigle et al. 2005) which uses the structure of the gas plume and how long it takes for parts of the plume to move from one point to another (illustrated in picture of plume from Etna above as lines [a] and [b]). So this how we make UV camera measurements! The frequency that images can be taken is generally every 1 second but this can potentially be increased to 15 or even 30. This has the obvious benefit of being able to measure rapidly changing volcanic gas emissions associated with explosive activity such as strombolian volcanism or during passive activity (the constant quiescent release of gas). We can also begin to compare SO2 flux measurements with other datasets collected at similar time frequencies (e.g., Burton et al. 2015 offer an overview of UV camera studies). The benefits offered with an increase in spatial resolution can allow us to image more than one source at the same time - perfect where more than one crater (e.g., Etna) may be emitting gases or we may be observing a number of fumaroles (e.g., Vulcano). I hope this has been interesting aside into one of the major pieces of equipment which allows me to do my research! My next post will be all about a low cost UV camera system developed at the University of Sheffield and recently published in the Journal - Sensors. References
|
 Archives
July 2023
|
 RSS Feed