|
Statistics is a vital aspect of a large variety of disciplines, particularly for the geographical sciences. However, the subject material can be a little dry and difficult to teach in an interesting way. But it really doesn't have to be like this! I try to innovate and incorporate a very modern and interactive teaching style for my lectures with interactive quizzing and lots of in-lectures discussions and problem solving. For statistics this can be a particular challenge, certainly for seminar based sessions which are often solely based upon reading and interpreting journal articles. Hence, my motivation for trying something new, of course to keep the students engaged and challenged but to keep me interested and on my toes too! 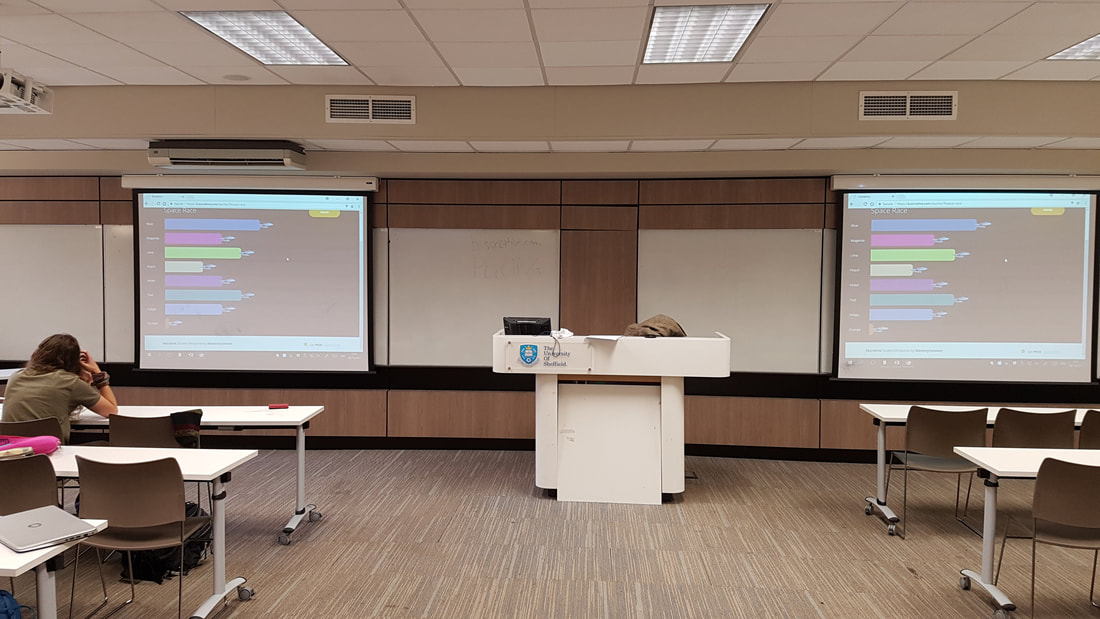 Half way through the session and Team Peach were trailing. Note: there was more than one student and the tweed on the lecturn. I therefore devised a session which incorporated the interpretation of a journal article with the application of statistical methods and eruption forecasting. The students first task was to extract important information about the changes in gas ratios from a journal article about the behaviour of Stromboli volcano and how this may help forecast a change in eruptive style, they also had to consider what statistics may be of use in such a situation. With the help of the interactive mobile quizzing software Socrative the students were then set a number of tasks aimed at helping them understand a developing (fictitious) volcanic crisis on Stromboli. This app allows teams to compete against each other in a "space race" adding a bit of fun competition to the challenge (and yes the icons are mini Starship Enterprises). The questions involved selecting the correct statistical techniques and calculating the correct answers to progress in the space race. The challenges, split up into months, had the students probing data to see if there were significant differences between background ratio levels and new ones, investigating explosion frequency, and looking at the relationship between seismic signals and strombolian explosion masses to help explore explosion masses during an unfortunate down period of the gas monitoring network. On the whole, the students found this a great way to begin applying their statistical knowledge to a believable, albeit fictitious, scenario. I would certainly recommend attempting innovative ways of enthusing and helping students learn about statistics! 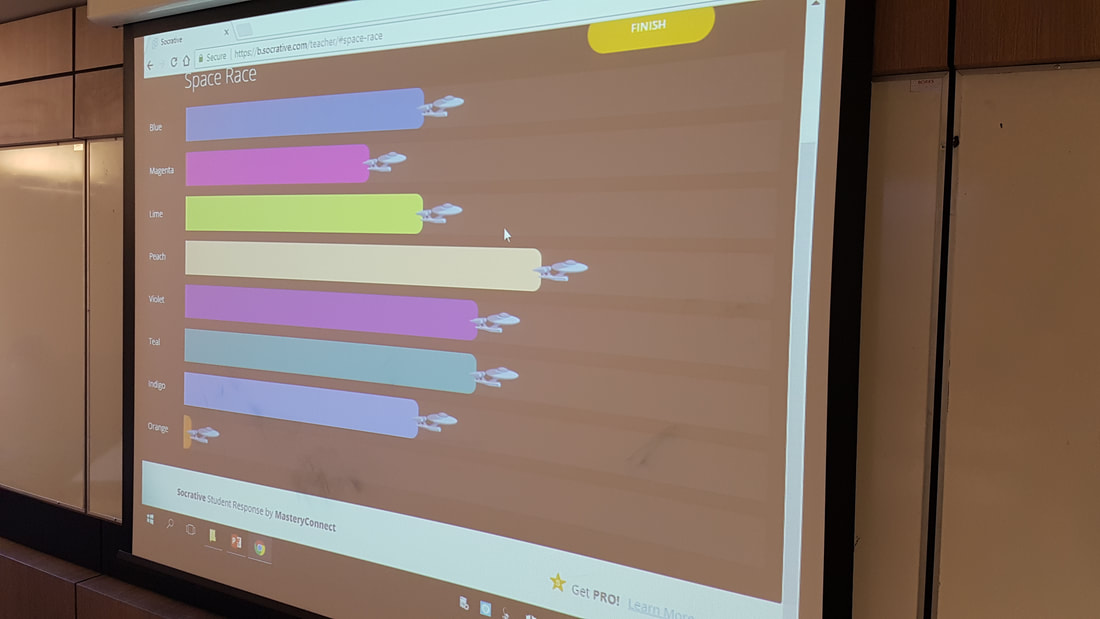 The Starship Enterprise "Peach" is the winner. The group in question wanted to stay longer to finish the tasks. 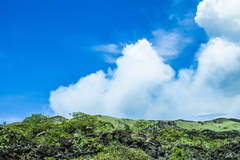 The plume at Masaya. The plume at Masaya. After a hectic summer involving fieldwork in Nicaragua, a trip to Slovakia, Portland (Oregon), and fun at the Langdales in the Lake District, the start of the new university year has taken me by surprise. Anyhow, back sometime in July I recieved an email from someone at the Sheffield-Esteli society, Esteli is a town in Nicaragua where the group teaches English, saying they had heard about my recent research trip from the Nicaraguan ambassador and would I like to do a talk for Sheffield-Esteli society and Students for Esteli. Apparently she found out about our trip from someone high up in government after our initial but brief customs experience. I of course agreed to do so, and would be talking alongside the ambassador.  Me alongside the Nicaraguan ambassador. Me alongside the Nicaraguan ambassador. I talked about our ongoing research into our low cost monitoring technique using the Raspberry Pi and its application to the volcano Masaya. It was great see such a diverse audience from emeritus professors, the Lord Mayor of Sheffield, members of staff, PhD students and a good number of current UG students. The ambassador then spoke about the importance of volcanoes to tourism and the energy industry. Meeting the ambassador and having the opportunity to talk to such a uniquely diverse group was a fantastic experience, it was certainly one of my best experiences of outreach and science communication so far. It was also great to engage with those whom your research may directly help in the future. If you fancy hearing more about my recent trip to Nicaragua, take a look at my YouTube playlist to see to hear more. 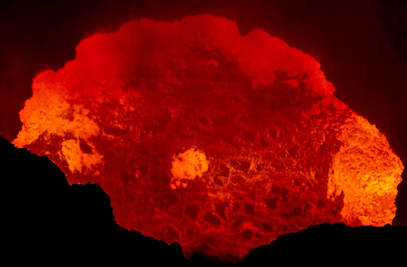 Masaya lava lake. |
 Archives
July 2023
|
 RSS Feed