Volcano Blog by Tom Pering
  • Blog
  • UV Cameras
  • Publications
  • Slug Calculator
  • About Me

An insight into life as a University Teaching Associate in numbers

15/1/2018

 
In September 2017 I started my second short-term contract as a Teaching Associate at the University of Sheffield. I started my first teaching contract in July 2016, following a short and low-paid research contract after my PhD. The past year and a bit have been a steep learning curve, life as a PhD student really didn't do much to prepare for the teaching (and admin) side of academia. So at the start of this term I decided to track my working day to see what I spent my time on and how long I actually spent working! I also thought that this would make an interesting blog post and may provide others with an insight into what life is like as a Teaching Associate/Early Career Academic. 

To track my work I created a number of categories for types of work that I conducted. Table 1 gives a summary of these. For every working day I then noted down how many hours I had spent on each. Note: these are approximate estimates, i.e., I don't have the time to account for everything to the exact minute. I have then investigated my working week and the types of work conducted (continues below Table 1).

Disclaimer: these are my personal experiences and may not represent workload/experiences at other universities or even different departments in the same university.
Table 1: ​A summary of different categories of work conducted over the year and their descriptions.
Category/Abbreviation
Description
Adm
Emails and administration
App
All kinds of application: grant, fellowships, jobs.
Bre
Time spent not working during working hours. Time between coming home and starting work again in the evening also counted as a break.
Coll
Research collaboration, internally and externally
Conf
Conference attendance and preparation. This includes professional development, i.e., non-research conferences/workshops.
Fiel
Fieldwork actual and preparation
Mark
Marking
Meet
Meetings, skype calls
Out
Outreach, open days, presentations, and blogging
Pap
Paper writing
Res
Actual research (that not conducted during fieldwork).
T Del
Teaching delivery in whatever guise it takes
T Prep
Preparation for teaching, e.g., writing lectures.
UG S
Undergraduate supervision, including personal tutees, dissertations, office hours.
PG S
Same as above but for postgraduate
​Oth
Anything else which isn't described above but may be expected as an academic, such as paper reviews
Overall, from the start of my new contract up to Christmas there were 16 working weeks. Here are some general figures from this period:
  • Total hours worked: 669 hours
  • Average hours worked per week: 41.8 hours
  • Average hours worked per day: 8.3 hours
  • Longest duration worked in a week: 59 hours
  • Longest duration worked in a day: 16 hours

I can then take a look at how this was distributed throughout the term, see Figure 1. In general, student presence, which was mainly between the weeks 5 and 14, was accompanied by an increasing workload week on week. There was a large range in my hours worked per week, peaking at almost 60 hours in Week 13, which was mostly associated with marking. On average I worked 6.8 hours per week more than my contracted hours.
Picture
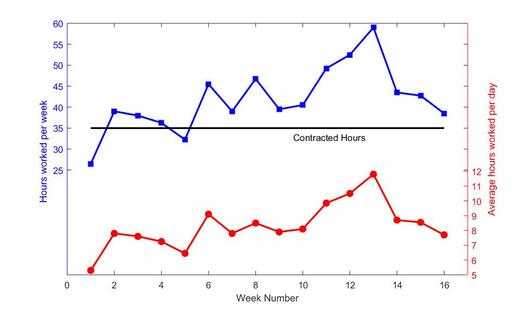
Figure 1: A look at total hours worked in a week (blue line, top) and average hours worked per day (red line, bottom).
Figure 2 then shows which categories of work I spent the most of my time on. Here are the top 5:
  1. Teaching preparation: 34%
  2. Marking: 19%
  3. Teaching delivery: 10%
  4. Undergraduate supervision: 8%
  5. Administration: 7%
These top 5 account for ~78% of my time. These categories above are perhaps not surprising as my contract is technically a teaching only contract, although I am also allowed time for research and professional development. Note though that these are percentages of my time spent not actual time so this does not give an indication of whether there was enough time for all tasks required.
Picture
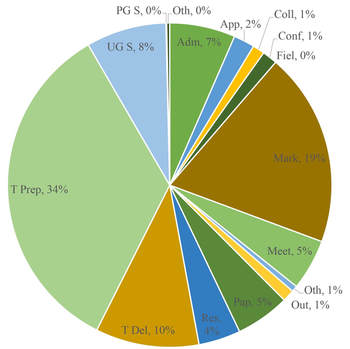
Figure 2: A pie chart highlighting the percentage of my total time I spent working on each type of work, see Table 1 for categories.
I then took a look at the distribution of selected tasks on a daily basis (Figure 3) to look at whether the type of tasks changed throughout the term. The major differences we can see here are the huge increase in marking towards the end of term. At the same time, teaching preparation levels are maintained at a similar level, whilst teaching delivery is quite variable week-to-week. The majority of workload increase can therefore be attributed to marking at the back end of term. 
Picture
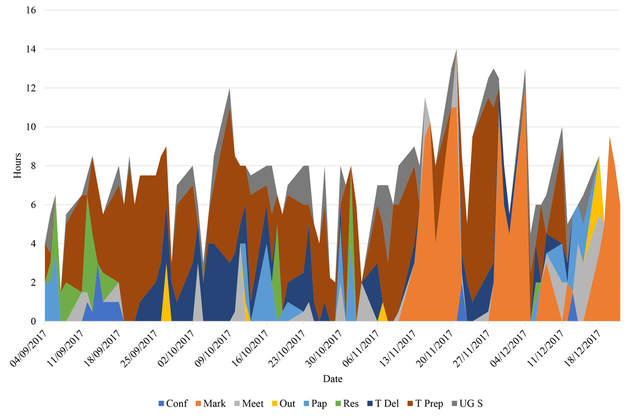
Figure 3: A stacked chart to show duration spent on selected tasks on a daily basis.
As an interesting aside I also compared the number of hours "allocated" in the department workload model for my teaching responsibilities which is encompassed by the categories for: teaching delivery, teaching prep, marking, and undergraduate supervision; to the actual time I spent on these.
  • Hours allocated using workload model: 336 hours
  • Actual time spent: 481 hours. 
This means that the actual time spent was ~43% higher than allocated in the workload model. A workload model is produced to try and create an even workload between staff members and to make sure that we are not given too much work. Whilst an underestimation of the model does still allow the head of department/lead academics to see workload split and who may have a low or high workload, there are still, however, several issues, particularly for early career academics:
  1. There doesn't appear to be any differentiation between writing new lectures and delivering existing lectures.
  2. A lecture may take an early career academic longer to write than a tenured professor who has been doing it for >20 years.
  3. An underestimation in allocated time means that your workforce may be busier than you realise.

So there we go, a snapshot look at life as a University Teaching Associate.

Comments are closed.
    Volcano Blog Logo

    RSS Feed

    Share this page

    Archives

    August 2022
    May 2022
    January 2021
    February 2020
    December 2019
    November 2019
    April 2019
    January 2019
    May 2018
    April 2018
    March 2018
    February 2018
    January 2018
    October 2017
    August 2017
    June 2017
    January 2017
    October 2016
    July 2016
    June 2016
    May 2016
    April 2016
    January 2016
    December 2015
    July 2015
    June 2015
    May 2015
    April 2015
    March 2015
    January 2015
    December 2014
    August 2014
    July 2014
    June 2014
    May 2014
    April 2014
    January 2014
    November 2013
    October 2013
    September 2013
    August 2013
    July 2013
    June 2013
    May 2013
    April 2013
    March 2013
    February 2013
    January 2013
    December 2012
    November 2012
    October 2012
    September 2012
    August 2012
    July 2012
    May 2012
    April 2012
    March 2012
    February 2012
    December 2011
    November 2011
    October 2011
    September 2011
    July 2011
    June 2011
    May 2011
    April 2011
    March 2011

An informative blog for anyone interested about all things volcano related!
  • Blog
  • UV Cameras
  • Publications
  • Slug Calculator
  • About Me