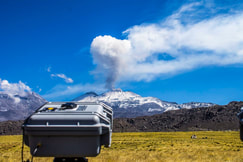
 The UV camera looking on to the plume of Sabancaya volcano. The UV camera looking on to the plume of Sabancaya volcano. The morning chill was still in the air as I stumbled out of my room. There is just that little something about going to a new volcano that generates an indescribable excitement which makes getting up super early bearable. Everyone was quite quiet in the 4 x 4, so I decided to plug in and listen to some tunes. We left Yanque, passed through Chivay, and after getting to the plateau on the road to Arequipa turned off on a relatively unmarked dirt track. At this point Sabancaya appeared less distant and was producing a nice ashy explosion, a quick stop for some photos and then away we went. As we continued to drive I was struck by the peace and quiet of the plateau. Two songs then channelled through my earphones: A Distant Discovery by James Horner (from Deep Impact) and Exogenesis Part 3 by Muse. These songs, whilst demonstrating my eclectic music taste, mirrored the calm of the landscape, punctuated by the volcanic activity of Sabancaya. I found myself reflecting on my journey so far and the decisions which I have made to get me to this stage and where I may be in the future. It was that kind of location, hopefully that helps, my contemplations (unfortunately or fortunately?) will remain my own. At points the landscape felt a little like we were on the Martian surface, just with a little bit more green stuff! Eventually we reached a spot nestled by a stream and what looked like a deserted somewhat luxury farmhouse. Part of the purpose for coming to Peru was to teach others to use our Raspberry Pi ultraviolet cameras. We decided to set up some cameras in the current location whilst others went further up the mountain. An intensive period of instruction and troubleshooting but also managed to get some great data at the same time. Bonus! The air was so thin up near Sabancaya that it was really nice to start heading down again, the oxygen flooding in makes one feel quite sleepy! The cure - head to the hot pools on other side of Yanque, once you have found where they were of course! See the accompanying video post below. Up we went again to Ubinas on Day 2 in Peru. This time with significantly more sleep under my belt, about 8.5 hours in total. I felt amazing! A return to Ubinas was debated the night before, but it was decided that a return may as well happen as we have another day for measurements. So through the traffic and erratic driving we went, up the now familiar windy gravelly roads. We seemed to get up to Ubinas much more quickly this time, I even had time to track the altitude at our highest point, maxing out at about 4644 m, definitely the highest I have ever been! Unfortunately, what greeted us at the summit were extensive clouds, and even some thunder and snow over the summit of Ubinas. We played the waiting game for maybe 2 hours, but the horizon was surrounded with clouds and the clapping of thunder. A little disappointing! Perhaps I have an idea for the data collected on Day 1 but we shall see what pans out. Back down we decided to go to our favourite little shop, buying them out of Inca Kola in the process. Nommy nommy. Just a short post given the relative lack of volcanic happenings, more from me soon. 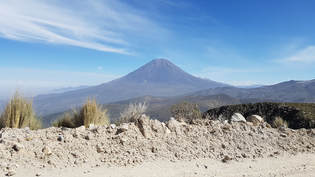 Misti volcano which overlooks Arequipa Misti volcano which overlooks Arequipa Arriving into Arequipa at 6:30 am I was starting to regret the plan of heading straight into the field. I was absolutely shattered, along with Tom Wilkes from Sheffield. Nevertheless, head up we did with some Chilean collaborators (the two Felipes!). A brief stop to have a shower and then off we went in our rented, and as I was about to find out entirely necessary, 4 by 4. This is my first visit to Peru. A place I have wanted to visit for a long time, so long I forget when I first wanted to travel here, lured by the mix of history, culture, and more recently the geology/volcanology. Travelling through Arequipa I was struck by similarities with Nicaragua, although the driving is by far the worst I have experienced on my various travels. Once through the bustle of Arequipa you start heading into the foothills and gain altitude very quickly, all the time accompanied by the looming Misti volcano which over looks the city. What a setting! 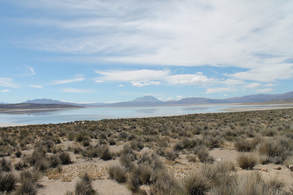 Shallow saline lake with Ubinas pictured centre image in the distance. Shallow saline lake with Ubinas pictured centre image in the distance. We ascended on winding gravelly roads, quickly reaching altitudes of >4000 metres. A level we would stay at for some time. We passed frequent herds (?) of llama and alpaca (and the other two types whose names escape me) and some very small mountain villages before emerging onto an incredible sight (see photo) a plateau containing, if I recall correctly, a saline shallow lake. All complete with wild flamingos! In the distance was our target volcano, Ubinas. After about 2.5 hours of driving, maybe more, we crested a small mound and there it was, Ubinas. Something immediately concerning for a remote sensor became apparent. There didn’t appear to be any gas coming out. However, on continual hopeful staring at the summit area we did eventually see sporadic emissions of gas from the summit area. 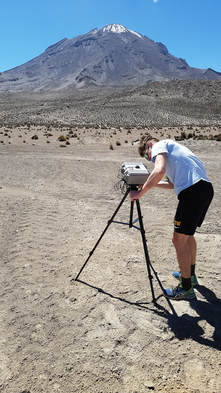 Tom Wilkes adjusting the UV cameras during measurements of Ubinas. Tom Wilkes adjusting the UV cameras during measurements of Ubinas. So we set up with our sulphur dioxide measuring ultraviolet cameras to get some data. See the video whilst up at the summit. After an hour(ish) of data, the clouds came in starting to obscure the summit, we decided to head back down. For me this was great as the lack of sleep mixed with lack of oxygen at altitude I think was starting to take its toll. On the way back, we stopped at a little village where one of the Felipes spotted a random building which appeared to be a shop. In we went to get sustenance as we were ill-prepared and didn’t bring lunch. Here me and Tom discovered Inca Cola, a little like Irn Bru but slightly less sweet and super tasty. This is also where I started to feel a little unwell. It was difficult to tell whether this was a result of exhaustion and lack of sleep or the start of acute mountain sickness or caffeine withdrawal or a mixture of everything. A small amount of nausea and a mild headache. Some coca cola (not the Inca stuff!) started to settle my stomach so the nausea passed quickly, as did the headache. Over the next hour we descended rapidly, the mild symptoms fully passed and I just felt exhausted. The evening was filled with dinner and an icebreaker to the workshop we are piggy-backing along (more in another post). I was probably not at my most chatty whilst mingling! A quick dinner then asleep by 8:30. And so ends Day number 1, which felt more like 3 days. I wrote this lengthier post than usual on the way up for Day 2 which you will hear about soon! See the accompanying video diary below. 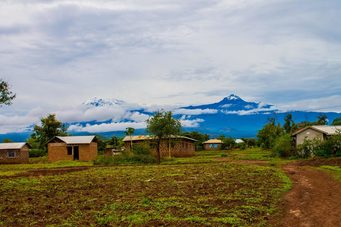 Kilimanjaro from Himo. Kilimanjaro from Himo. The longer title of this post reads – “Out and about in Tanzania: the wanderings and musings of a volcanologist on an international development fieldtrip”. Why is a volcanologist on a human geography fieldtrip you may ask... The short answer is the desire for a more well-rounded look at international development issues which may include environmental concerns and that someone was needed on the ground to help with this. As ever, the longer answer is much more complicated and boring. So, here I am, sitting on the porch of my room (with a nice king size bed), being bitten mercilessly by every insect which passes. Apparently, all my super strength bug repellent does is attract more of the creepy crawly critters.
This is my first experience of Africa, and wow, it doesn’t disappoint: happy smiling children shouting and waving (check), bus stuck in the mud with locals pouring out from everywhere to help (check), some of the friendliest happiest people I have ever met (check), encounters with completely safe animals like scorpions (check), other interesting critters like the praying mantis (check), lots of Arsenal/Chelsea/Man Utd fans (check), and see one of the most iconic volcanoes on the African continent in Kilimanjaro (check). Still lots more to come I am sure, with a safari tagged on to the end. Unfortunately, this is not a completely social trip (I am working, honest!) so there have been work items to fill up my time, teaching students to look at the properties of water and soil has been a focus. But, as I mentioned this is a predominantly human geography fieldtrip so I have been exposed to and accompanied students whilst conducting interviews, which means I actually have to speak to and interact with people (breaks out in cold sweat), something which is completely foreign to me and my volcanic gases. Surprisingly, I have actually really enjoyed this and found this a really valuable personal experience. After a crash course on interviewing prior to leaving, I have done my best to provide feedback to students “in the field”. A very different experience to my usual hiking up a mountain, instead wandering round villages looking for locals to speak to with the help of guides. Note to self, if a local is irritably chopping a machete against a pole, don’t ask for an interview. The whole trip has really opened up my eyes to international development issues and got me thinking about its successes, failures, and the extent to which it benefits locals. One of the more memorable moments was during an interview with someone who has worked in the Kilimanjaro national park, but who was now retired. They were one of the friendliest and knowledgeable people I have met, but not conducive to a good interview (yes, I now know some of the key factors, I wonder, am I a jack-of-all-trades or a master-of-none?), which was aimed at soliciting information at tourism. Classic rambling answers and interruptions from randomers, we even gained some great advice on marriage, growing vegetables, and metaphors on stages of life! I was most disappointed that I was labelled as “midday” and all the students “sunrise”. Today is the end of the research stage, so things slow down for me slightly. A visit to nearby Moshi tomorrow. I am not sure whether I should be horrified or not, but someone actually told me “we will make a good human geographer of you yet”. Perhaps I need to climb a mountain soon and do some science, I wonder if there is one nearby… 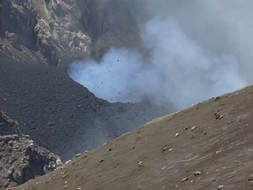 Rapid strombolian activity at Mt. Etna in July 2012. Rapid strombolian activity at Mt. Etna in July 2012. The above is probably what I wish I had called one of my recently published papers, which have looked at the behaviour of large gas bubbles which ascend and burst at the surface (I'll make an amusing title a future career goal...). To understand more about the eruptions we see at the surface we have to investigate what we can't see below the surface and then try and make links between the two. A lot of my work has focused on one style of behaviour in particular, that of strombolian explosions. Strombolian explosions are likely driven by large gas bubbles which we call Taylor bubbles or gas slugs, named after one of the authors in the following paper (Davies and Taylor, 1950). The archetypal location for strombolian activity is on the island of Stromboli, but similar styles of activity also occur at other locations. A lot of work has been put into understanding the dynamics of single Taylor bubbles ascending in conduits, however, far less has been done for multiple Taylor bubbles ascending in close proximity and which may interact during ascent. This is what my recent paper "The dynamics of slug trains in volcanic conduits: evidence for expansion driven coalescence" begins to investigate through the use of analogue experiments (see video below for 30 s clips of the experiments which were shot using super-slow-motion cameras). These experiments were inspired somewhat by activity I observed and investigated in 2012 within the Bocca Nuova crater of Mt Etna. In particular, we were interested in the ability for individual Taylor bubbles to interact and join together during coalescence, and how this may have affected the distribution of each bubble. For more information on this work see the paper here, which is open access! The other paper published "Combining Spherical-Cap and Taylor Bubble Fluid Dynamics with Plume Measurements to Characterize Basaltic Degassing" involved the construction and illustration of a brand new model which describes the styles of activity we see at volcanoes such as Stromboli based on the ability of bubbles to interact and the time separating each individual burst at the surface. The aim of this paper is to bring together observations of gas emissions and explosive activity at the surface with the behaviour of bubbles as they ascend in the conduit at depth. This paper can be found here, and is also open access. In September 2017 I started my second short-term contract as a Teaching Associate at the University of Sheffield. I started my first teaching contract in July 2016, following a short and low-paid research contract after my PhD. The past year and a bit have been a steep learning curve, life as a PhD student really didn't do much to prepare for the teaching (and admin) side of academia. So at the start of this term I decided to track my working day to see what I spent my time on and how long I actually spent working! I also thought that this would make an interesting blog post and may provide others with an insight into what life is like as a Teaching Associate/Early Career Academic. To track my work I created a number of categories for types of work that I conducted. Table 1 gives a summary of these. For every working day I then noted down how many hours I had spent on each. Note: these are approximate estimates, i.e., I don't have the time to account for everything to the exact minute. I have then investigated my working week and the types of work conducted (continues below Table 1). Disclaimer: these are my personal experiences and may not represent workload/experiences at other universities or even different departments in the same university. Table 1: A summary of different categories of work conducted over the year and their descriptions.
Overall, from the start of my new contract up to Christmas there were 16 working weeks. Here are some general figures from this period:
I can then take a look at how this was distributed throughout the term, see Figure 1. In general, student presence, which was mainly between the weeks 5 and 14, was accompanied by an increasing workload week on week. There was a large range in my hours worked per week, peaking at almost 60 hours in Week 13, which was mostly associated with marking. On average I worked 6.8 hours per week more than my contracted hours. 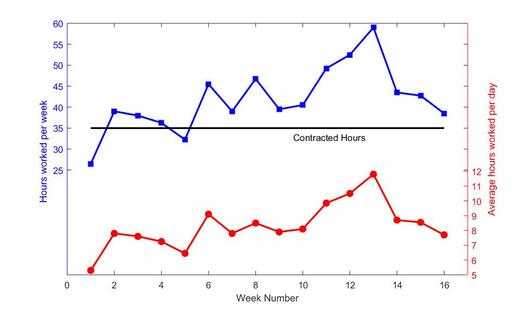 Figure 1: A look at total hours worked in a week (blue line, top) and average hours worked per day (red line, bottom). Figure 2 then shows which categories of work I spent the most of my time on. Here are the top 5:
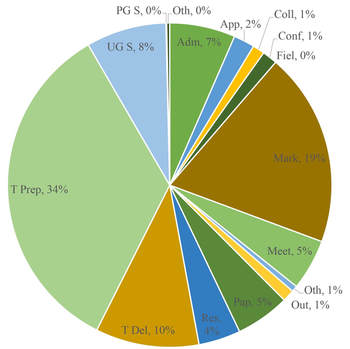 Figure 2: A pie chart highlighting the percentage of my total time I spent working on each type of work, see Table 1 for categories. I then took a look at the distribution of selected tasks on a daily basis (Figure 3) to look at whether the type of tasks changed throughout the term. The major differences we can see here are the huge increase in marking towards the end of term. At the same time, teaching preparation levels are maintained at a similar level, whilst teaching delivery is quite variable week-to-week. The majority of workload increase can therefore be attributed to marking at the back end of term. 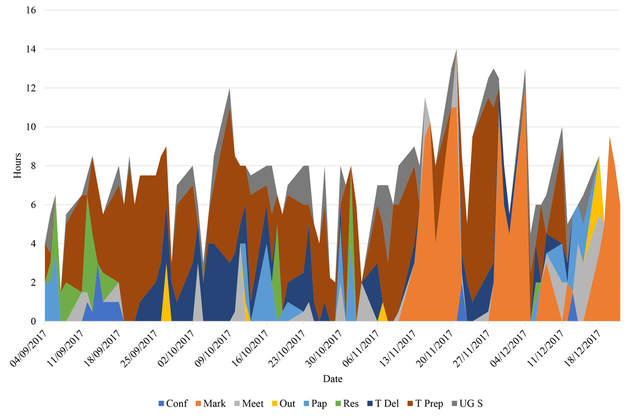 Figure 3: A stacked chart to show duration spent on selected tasks on a daily basis. As an interesting aside I also compared the number of hours "allocated" in the department workload model for my teaching responsibilities which is encompassed by the categories for: teaching delivery, teaching prep, marking, and undergraduate supervision; to the actual time I spent on these.
So there we go, a snapshot look at life as a University Teaching Associate. Statistics is a vital aspect of a large variety of disciplines, particularly for the geographical sciences. However, the subject material can be a little dry and difficult to teach in an interesting way. But it really doesn't have to be like this! I try to innovate and incorporate a very modern and interactive teaching style for my lectures with interactive quizzing and lots of in-lectures discussions and problem solving. For statistics this can be a particular challenge, certainly for seminar based sessions which are often solely based upon reading and interpreting journal articles. Hence, my motivation for trying something new, of course to keep the students engaged and challenged but to keep me interested and on my toes too! 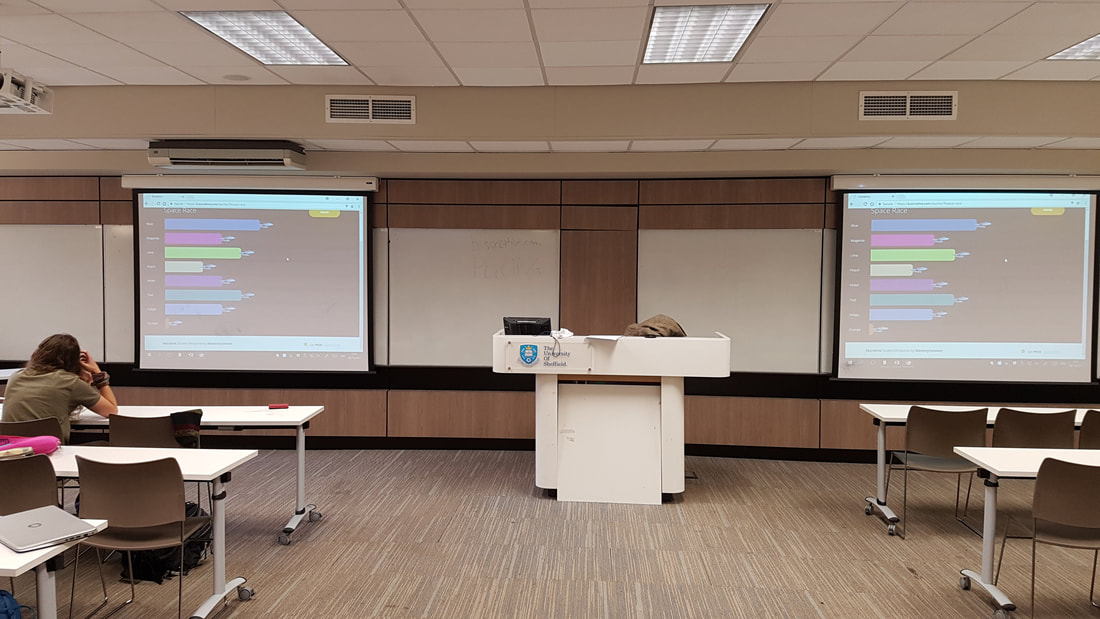 Half way through the session and Team Peach were trailing. Note: there was more than one student and the tweed on the lecturn. I therefore devised a session which incorporated the interpretation of a journal article with the application of statistical methods and eruption forecasting. The students first task was to extract important information about the changes in gas ratios from a journal article about the behaviour of Stromboli volcano and how this may help forecast a change in eruptive style, they also had to consider what statistics may be of use in such a situation. With the help of the interactive mobile quizzing software Socrative the students were then set a number of tasks aimed at helping them understand a developing (fictitious) volcanic crisis on Stromboli. This app allows teams to compete against each other in a "space race" adding a bit of fun competition to the challenge (and yes the icons are mini Starship Enterprises). The questions involved selecting the correct statistical techniques and calculating the correct answers to progress in the space race. The challenges, split up into months, had the students probing data to see if there were significant differences between background ratio levels and new ones, investigating explosion frequency, and looking at the relationship between seismic signals and strombolian explosion masses to help explore explosion masses during an unfortunate down period of the gas monitoring network. On the whole, the students found this a great way to begin applying their statistical knowledge to a believable, albeit fictitious, scenario. I would certainly recommend attempting innovative ways of enthusing and helping students learn about statistics! 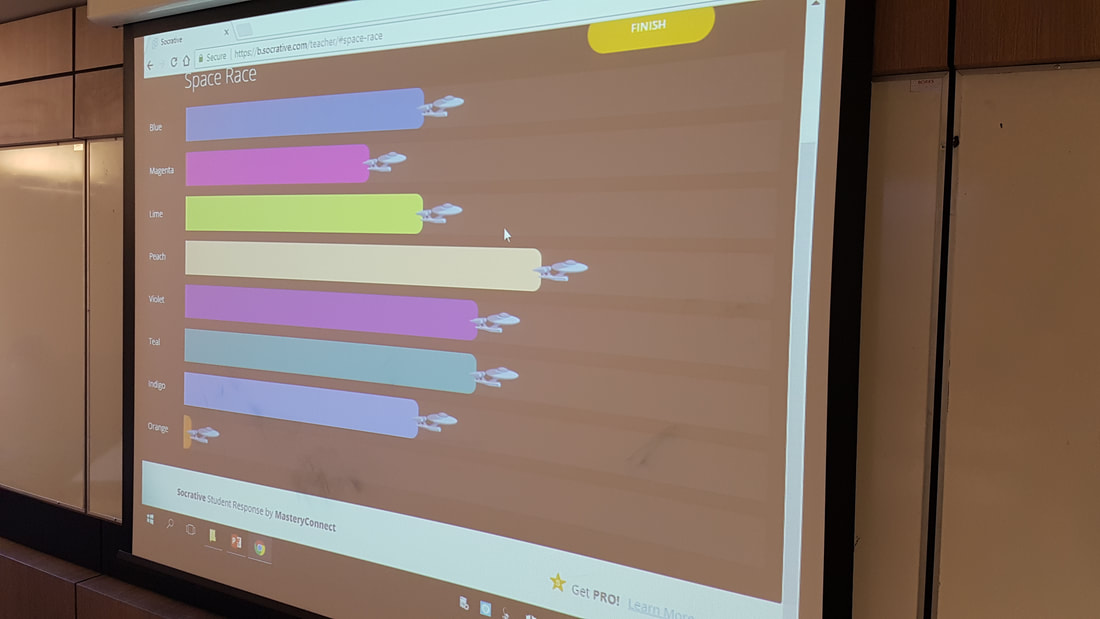 The Starship Enterprise "Peach" is the winner. The group in question wanted to stay longer to finish the tasks.  The plume at Masaya. The plume at Masaya. After a hectic summer involving fieldwork in Nicaragua, a trip to Slovakia, Portland (Oregon), and fun at the Langdales in the Lake District, the start of the new university year has taken me by surprise. Anyhow, back sometime in July I recieved an email from someone at the Sheffield-Esteli society, Esteli is a town in Nicaragua where the group teaches English, saying they had heard about my recent research trip from the Nicaraguan ambassador and would I like to do a talk for Sheffield-Esteli society and Students for Esteli. Apparently she found out about our trip from someone high up in government after our initial but brief customs experience. I of course agreed to do so, and would be talking alongside the ambassador. 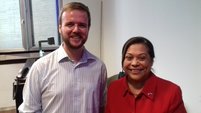 Me alongside the Nicaraguan ambassador. Me alongside the Nicaraguan ambassador. I talked about our ongoing research into our low cost monitoring technique using the Raspberry Pi and its application to the volcano Masaya. It was great see such a diverse audience from emeritus professors, the Lord Mayor of Sheffield, members of staff, PhD students and a good number of current UG students. The ambassador then spoke about the importance of volcanoes to tourism and the energy industry. Meeting the ambassador and having the opportunity to talk to such a uniquely diverse group was a fantastic experience, it was certainly one of my best experiences of outreach and science communication so far. It was also great to engage with those whom your research may directly help in the future. If you fancy hearing more about my recent trip to Nicaragua, take a look at my YouTube playlist to see to hear more. 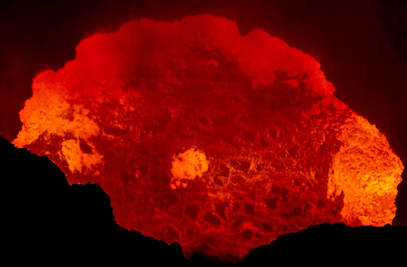 Masaya lava lake. IAVCEI, the shortened version of a very length name, is one of those conferences which comes about every 4 years, and is accompanied by a healthy dose of anticipation at the same time. To describe what IAVCEI is I am going to steal a friends phrase who described IAVCEI as "the world cup of volcanology", this is a great analogy as it encompasses the excitement of the event with the standard of science that is conducted. My first IAVCEI was in Japan four years, and included a fortuitous viewing of an erupting Sakurajima, so I was certainly looking forward to this one! 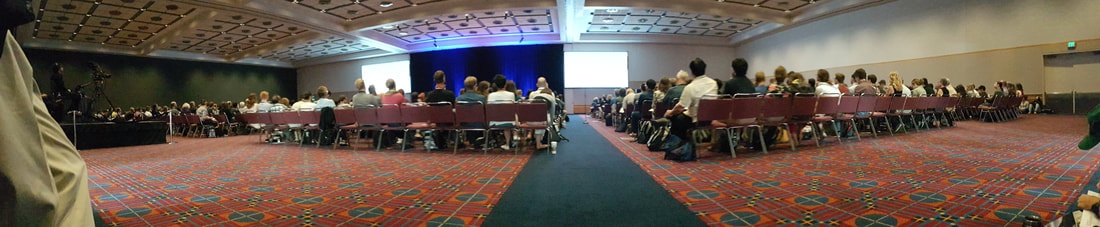 I was a little tardy to the opening ceremony...but had a good view of the large number of volcanologists in attendance! 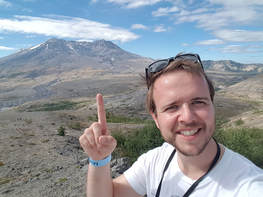 Me pointing to Mt St Helens.... Me pointing to Mt St Helens.... As always these conferences start with conglomerations of groups catching up after what may have been a long time since the last meet and then it's straight into the sessions. Given that this is a volcanology specific conference there was frequently more than one session of interest so there was a lot of running around between different rooms. I gave a talk on some of our recent work at Sheffield on low-cost ultraviolet remote sensing. The poster sessions, whilst 2 hours in duration, were still no where near long enough to get to everyone you wanted to talk to! These are a great time to seek people out to not only discuss the work on posters but also chat about other work and common interests, all over a frosty cold beer in a friendly and relaxed environment. Also kudos to the organisers for selecting breweries with themed beers, some of my favourites included: Mozaic Eruption IPA, Caldera Dry Hopped Orange, and Pyroclastic Porter! This conference was also one of the best I have been to for early career academics, with several specifically tailored events and socials, which were definitely appreciated. One of the amazing aspects of the IAVCEI conferences is the midweek break in between which incorporates a field trip. There were several options including Mt. Hood and the Columbia River Gorge but I just couldn't look past a trip to Mt St Helens to observe the location and result of the iconic and infamous eruption of 1980 (pictures above and below). I have been teaching volcanology for a few years now and St Helens often features, seeing the deposits and location in person was extremely valuable. I am now able to match up the numerous pictures with the locations! An added bonus was being led on the guided tour by geologist Richard Waitt, who just so happened to be with the USGS and in the area at the time of the 1980 eruption. An incredible wealth of knowledge which was fascinating to listen to. To top off a productive week, there was also a solar eclipse on the following Monday! Roll on the next IAVCEI in New Zealand... 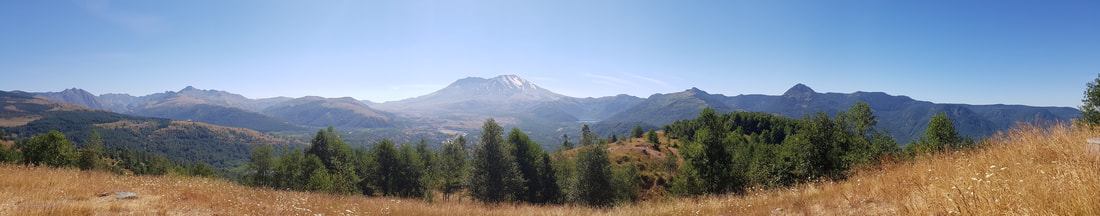 A panorama of the vista surrounding Mt St Helens (centre). 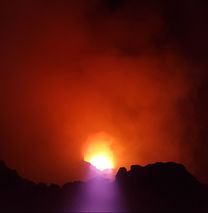 The eerie and stunning lava lake at night. The eerie and stunning lava lake at night. It has been a busy few days here in Nicaragua with lots more data collection. We have done a fair bit of fieldwork using all of our equipment in various locations and at various times. One of the more exciting and spectacular parts of the fieldwork was our conduction of thermal camera measurements at the summit at nighttime to maximise the amount of light that could be collected by the cameras. The lava lake as spectacular during the day but absolutely stunning during the evening. The vigour of the lake and strength of light given off by the lava even more apparent at night, and also really valuable for our data collection. We also managed to get some more UV camera data on the flanks in a slightly better position to see the whole plume. One of the great new features of our cameras is the ability to wirelessly connect to the cameras. This may seem like an obvious feature, but previously we had many cumbersome wires flying everywhere! 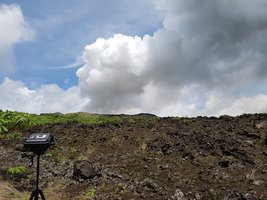 A UV camera pointed at the gas plume of Masaya. A UV camera pointed at the gas plume of Masaya. We also became plume chasers as we hunted down the position of the gas plume to perform traverses beneath using our spectrometer. This is a way of building up a plume profile to estimate flux of gas from the summit. We had a hard time actually seeing the plume to begin with because of low clouds, but eventually when the cloud level raised slightly, the plume, which has a reddish-brown hue to it, appeared in a completely opposite direction to the one it usually travels. It turned out we had already passed the plume within 10 minutes of leaving the hotel! On the final day we managed to acquire some synchronous thermal and UV camera data and then finished early to make sure all data was backed up and equipment packed up before our flight home. The past 10 days have been quite tiring but we head home with hopefully a fantastic set of data. It is very rare to go home having achieved all your aims and maybe a little more beyond this. See below for the accompanying video. |
 Archives
July 2023
|
 RSS Feed